

The world’s three largest trade hubs are continuing to see significant disruption. Tariffs, shifting supply chains, port congestion, and airfreight volatility are affecting the flow of goods and the balance of global commerce. Read on for our analysis of current trends.
China – North America
China’s share of U.S. imports has dropped to 12%, down from 22% in 2018. The U.S–China trade deficit has also narrowed, from $418 billion in 2018 to $280 billion in 2025, as American companies source more from Vietnam, India, and Indonesia.
Tariffs and Policy Moves
- A 90-day tariff pause is in place until November 11, 2025, but duties could surge up to 145% of goods’ value if negotiations fail.
- The U.S. ended the “de minimis” exemption for low-value imports in August, directly hitting Chinese e-commerce shipments.
- Under Section 301 measures, new fees now apply to Chinese-linked maritime services—$120–$250 per container.
Trade Flows
China’s exports rose 7.2% year-on-year in July, with imports up 4.1%, but growth is shifting away from the U.S. toward Southeast Asia. Analysts warn of a slowdown later this year as tariffs bite and rerouting via third countries faces tighter enforcement.
Transport Markets
- Ocean freight: U.S. imports reached 2.62 million TEUs in July, nearly a record, as companies rushed shipments before tariffs. However, volumes are expected to have stagnated in August. We’re beginning to see smaller carriers dropping their rates to compensate.
- Airfreight: A tariff-driven surge in August pushed U.S. West Coast rates higher. North America → Asia traffic fell 6% in weight but still saw 2% higher pricing, reflecting continuing volatility.
China – Europe
China is redirecting more exports to Europe and Southeast Asia, although the EU struggles with the consequences of tariff-driven stockpiling. EU Industrial production fell 1.3% in June, with Germany (-2.3%) and Ireland (-11%) pulling down the overall results.
Ocean Freight
- Asia → Europe: Demand is strong and vessels are booked 2–3 weeks in advance, but carriers are blanking sailings and there are some indications that rates may be starting to come down, despite remaining steady over the summer months.
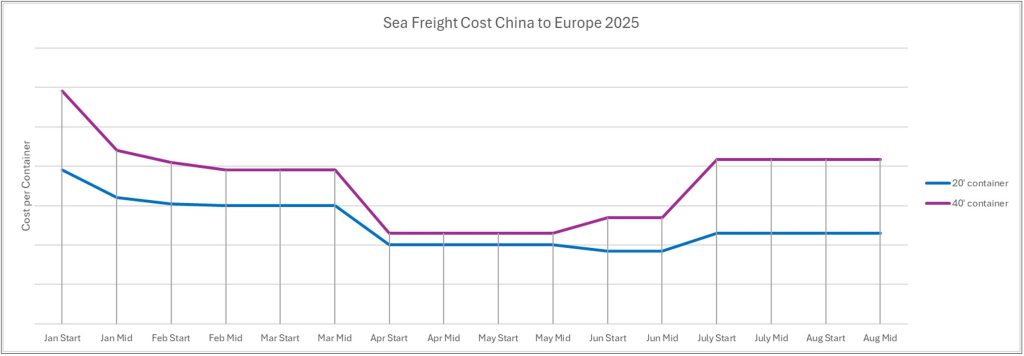
- Europe → Asia: Space is plentiful due to weak summer demand, with rates stabilizing at historically low levels.
Port Bottlenecks
Congestion is acute at major EU ports including Rotterdam, Antwerp, and Hamburg. Terminal utilization has reached as high as 95%, stretching yard space and slowing turnaround times.
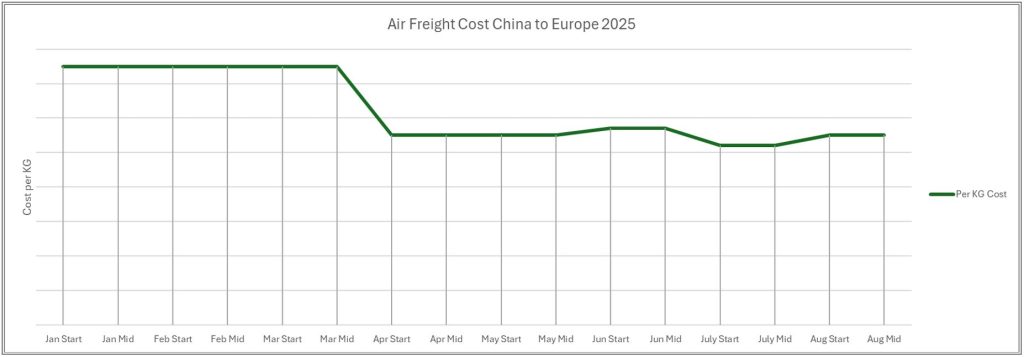
Airfreight
Added summer capacity has eased prices slightly, though bottlenecks remain at Europe’s largest airports.
North America – Europe
The U.S. has signed new trade agreements with the EU and UK, aiming for greater stability. Yet high tariffs remain—steel and aluminium imports are still subject to 50% duties. European exports to the U.S. have slumped, especially in pharmaceuticals.
Ocean Freight
- Europe → North America: Demand is steady, but port congestion in Europe disrupts operations. MSC is discontinuing its NEUSEC1 service, forcing rerouting.
- North America → Europe: Rates are relatively stable but exposed to tariff-driven uncertainty.
Market Leadership
MSC remains the dominant transatlantic carrier, with a 41.8% share, while Maersk and Hapag-Lloyd (via the Gemini Cooperation) are expanding but still smaller.
Airfreight
Traffic from North America to Europe grew 1%, with rates rising at the same pace. While relatively stable, the market remains vulnerable to political shifts and tariff changes.
Broader Outlook
Global container demand has been revised upward to +2.6% in 2025, but oversupply of vessels will keep freight rates under pressure for several years—likely until 2029.
Reliability and Costs
- Global schedule reliability improved to 67.4%, the highest since 2023.
- Trade-specific reliability: Europe–North America 74%, North America–Europe 69.6%, Asia–Europe 68.2%.
Strategic Shifts to Keep in Mind
- U.S. trade policy continues to steer supply chains.
- Companies are accelerating diversification away from China, with Southeast Asia and India becoming key.
Europe faces industrial slowdown from disrupted exports, while North America remains a strong but volatile import market.
September Summary
Global trade across the China–North America–Europe triangle is a changing picture, affected by tariffs, congestion, and shifting production patterns. Ocean reliability is improving, but oversupply of vessels and tariff uncertainty means continued volatility for the markets. For businesses, the challenge is clear: adapt to disruption, diversify supply chains, and stay agile in a rapidly changing trade environment.
If your business is experiencing challenges related to supply chain management and staying profitable in today’s market, contact us to find out how we can help.
James Cooney, Head of Logistics & Inventory


")

")
